The Diversity of Texas
The borders of Texas encompass an area whose size and diversity are those of a nation.
As an independent country, Texas would be among the 50 largest in the world by population, the 40 largest by land area, and in the top 15 by gross domestic product. Four primary topological regions meet in Texas, with each extending far beyond the state's borders: the Gulf Coastal Plain, the Interior Lowlands, the High Plains, and the Basin and Range region. The Gulf Coastal Plain extends from the line of the Balcones Escarpment near San Antonio and Austin to the Atlantic Coast of the US.
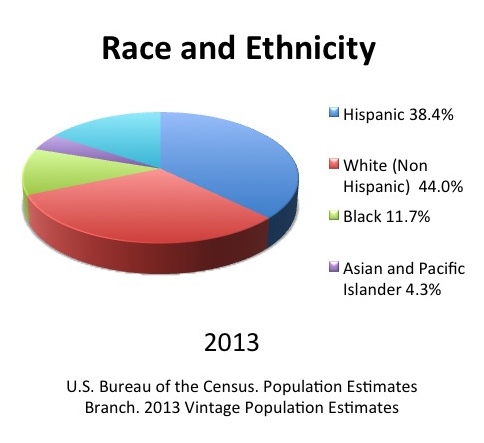
The Interior Lowlands extend westward from the Coastal Plain to the Caprock and the High Plains to the West and past the Canadian border to the North. The High Plains likewise encompass the area between the Caprock Escarpment on the East and the Rocky Mountains on the West, and like the Interior Lowlands extend northward far beyond the Texas border. Finally, the Basin and Range area encompasses the area of the Big Bend and El Paso and extends westward and Northward into New Mexico. The population of Texas has no racial and ethnic majority. Non-Hispanic Whites were 44 percent of the state's population at the most recent estimates in 2013, and Hispanics were just over 38 percent. The Hispanic share is growing by about one percent every year and is expected to overtake the non-Hispanic White share before the 2020 census. Asian and Pacific Islander populations are also growing quickly, and are now nearly 5 percent of the state's population.
Population
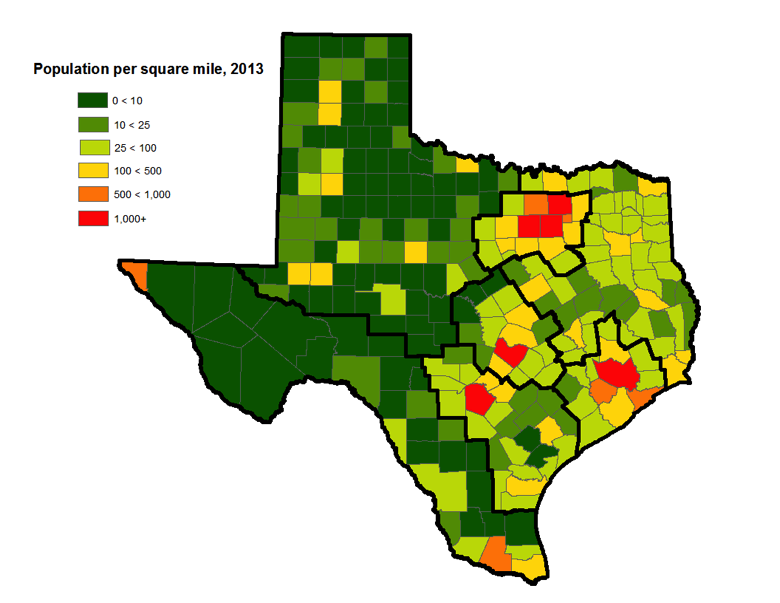
The population of Texas is unevenly distributed throughout the state. In 2014, population density varied from a high of 2,891 persons per square mile in Dallas County to a low of 0.13 persons per square mile in Loving County. One-third of Texas' 254 counties (86) had a population density of fewer than 10 persons per square mile. These counties were primarily located in the western portion of the state.
Six counties had a population in excess of 1,000 persons per square mile, including Dallas, Harris (Houston), Tarrant (Fort Worth), Bexar (San Antonio), Travis (Austin), and Collin (Plano, Carrollton, Richardson). Those 6 counties are home to nearly half (47%) of the population of the state.
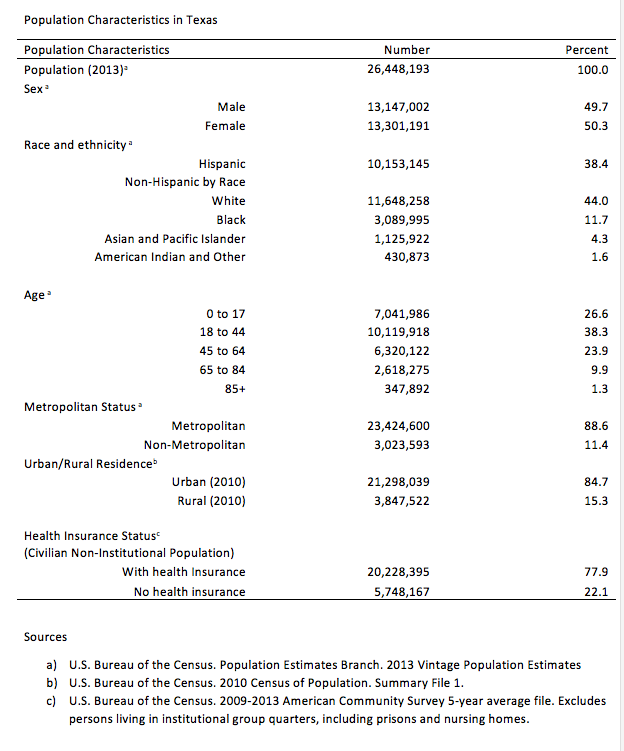
Texas has been one of the fastest-growing states in the United States since the mid-1980s. See Population Characteristics in Texas. Population growth in Texas is driven by a combination of factors—a young age structure with a large population share of childbearing age, a relatively high birth rate, a sustained pattern of high rates of both immigration from other counties, and internal migration from other states.
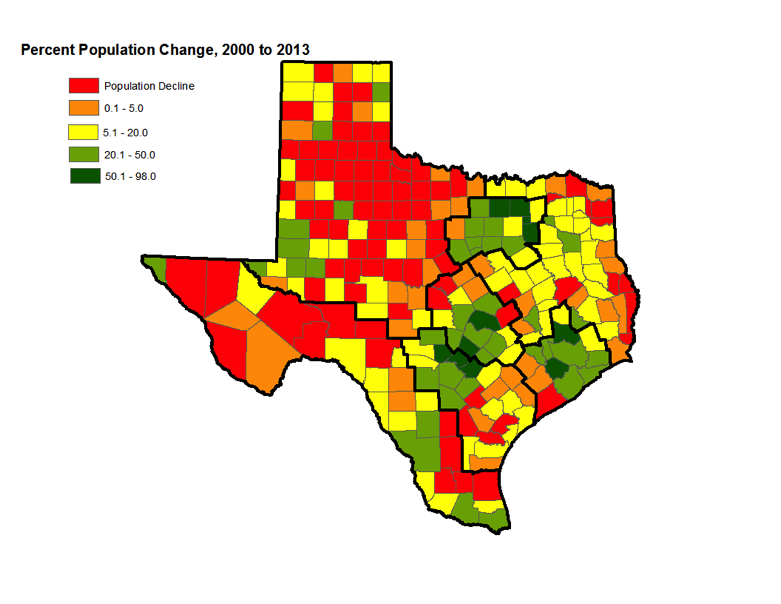
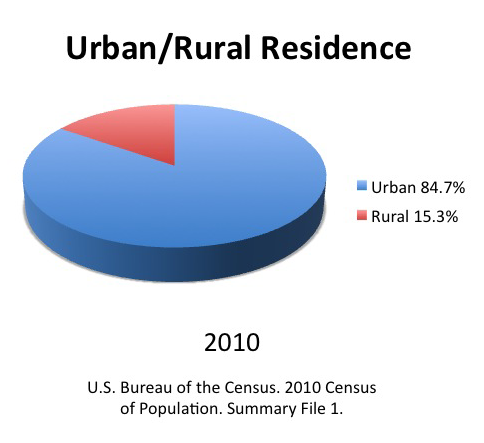
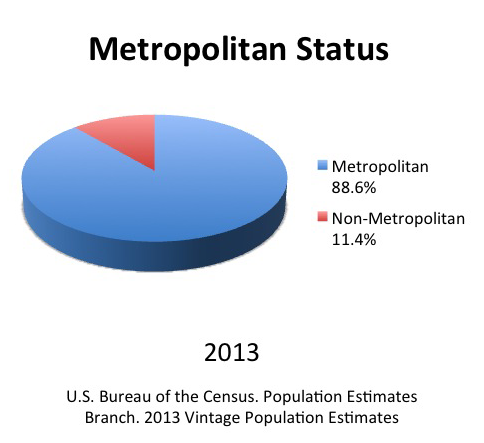
This growth is increasing the population density and concentration in the state's large metropolitan centers, and especially in the suburban counties around the state's largest cities. Eleven counties added more than 50 percent to their population between 2000 and 2013. All of these counties were in the suburban ring surrounding the cities of Dallas, Houston, Austin, and San Antonio. The counties that are home to these cities—Dallas, Harris, Travis, and Bexar—increased by more than 20 percent, as did the metropolitan counties along the border. By contrast, 85 of the 254 counties of Texas lost population between 2000 and 2012. The majority of counties losing population were concentrated in areas in West Texas and the Panhandle, counties with previously small populations.
Characteristics
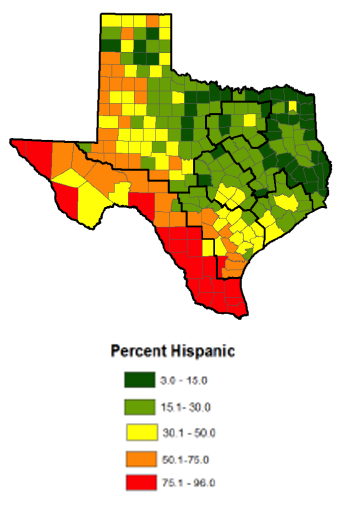
The population of Texas has no racial and ethnic majority. Non-Hispanic Whites were 44 percent of the state's population at the most recent estimates in 2013, and Hispanics were just over 38 percent. The Hispanic share is growing by about one percent every year and is expected to overtake the non-Hispanic White share before the 2020 census. Asian and Pacific Islander populations are also growing quickly, and are now nearly 5 percent of the state's population. The racial and ethnic populations of Texas live in different parts of the state. Non-Hispanic Whites live throughout the state, but are over-represented in both East Texas and the Panhandle and West Texas, and are under-represented in the border region.
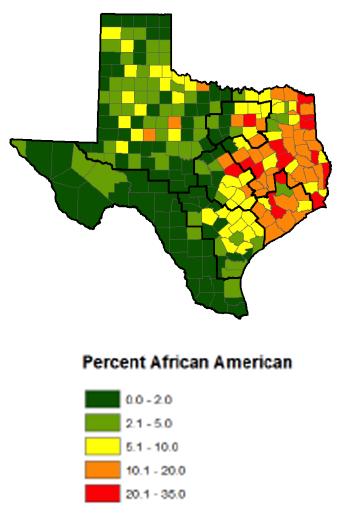
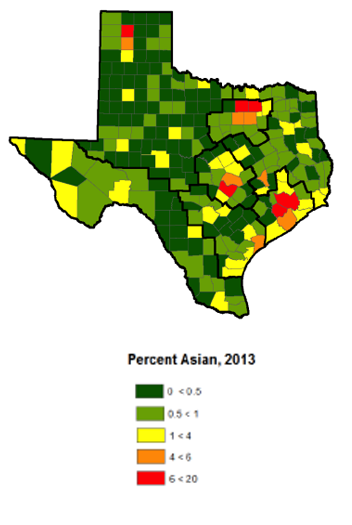
African Americans are especially concentrated in East Texas and in several of the state's largest metropolitan areas, especially Houston, Dallas-Fort Worth, and Austin. Hispanics are an especially large population share in the border region and in San Antonio but are also well-represented in the Houston and Dallas areas. Asian and Pacific Islander population is especially concentrated in Harris (Houston), Dallas and Travis (Austin) counties and some nearby suburban counties.
Race and Ethnicity by County
Age 65+
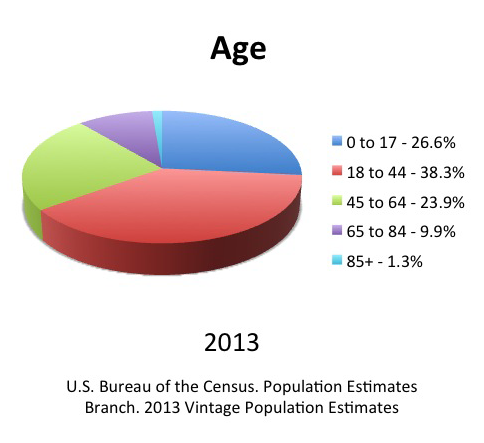
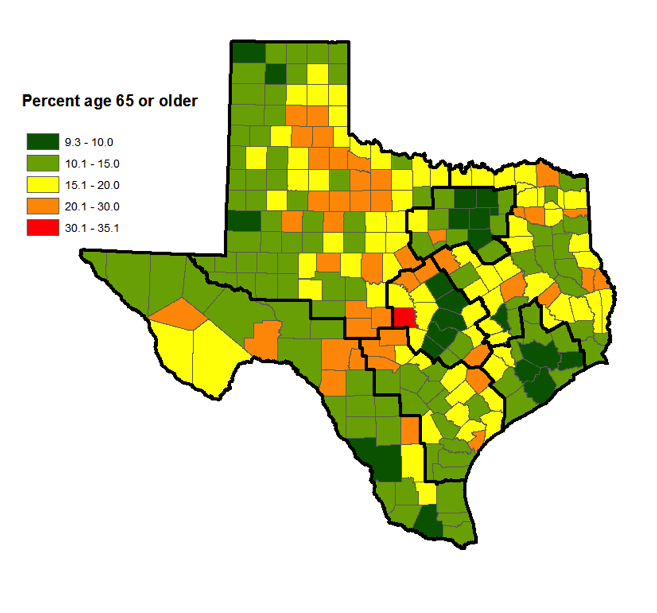
The Texas population is relatively young. The median age in Texas is 34.0 years, compared to 37.5 years for the United States as a whole. Eleven percent of the state's population is 65-years-old or older, compared to 14 percent for the United States. The share of the population that is 65-years-old or older varies sharply throughout the state. In most of the state's largest metropolitan counties, this share is less than 20 percent. In many of the counties with low population density in rural areas in West Texas and East Texas, this share exceeds 20 percent. The tendency for older populations to concentrate particularly in low-density rural areas presents a significant challenge to the delivery of health care services to the aging populations of these areas.
Socio-Economic Status
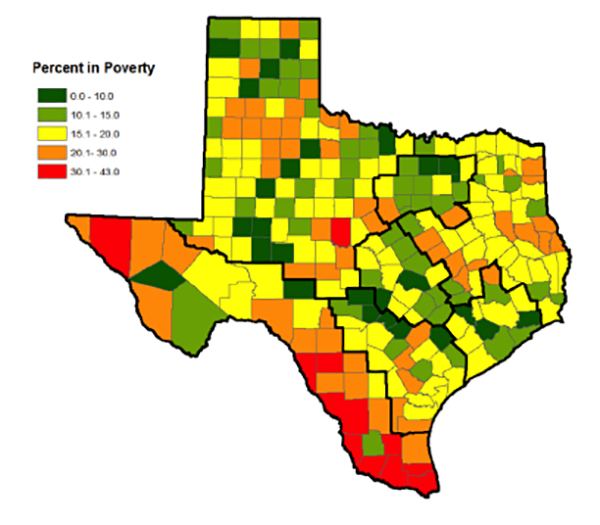
The economic resources available in different parts of the State vary dramatically. The poverty rate is highest - greater than 30% of the household population with an income under the federal poverty line - in many counties along the border. Poverty rates are also high in many rural counties in West Texas and the Panhandle, and East Texas. Poverty rates are lowest in many of the fast-growing suburban counties in the Dallas, Austin, San Antonio, and Houston metropolitan areas.
Health Insurance
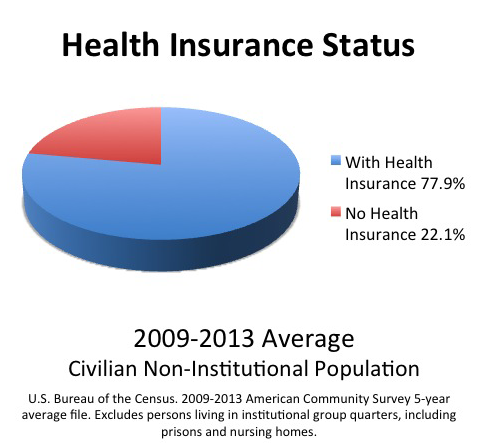
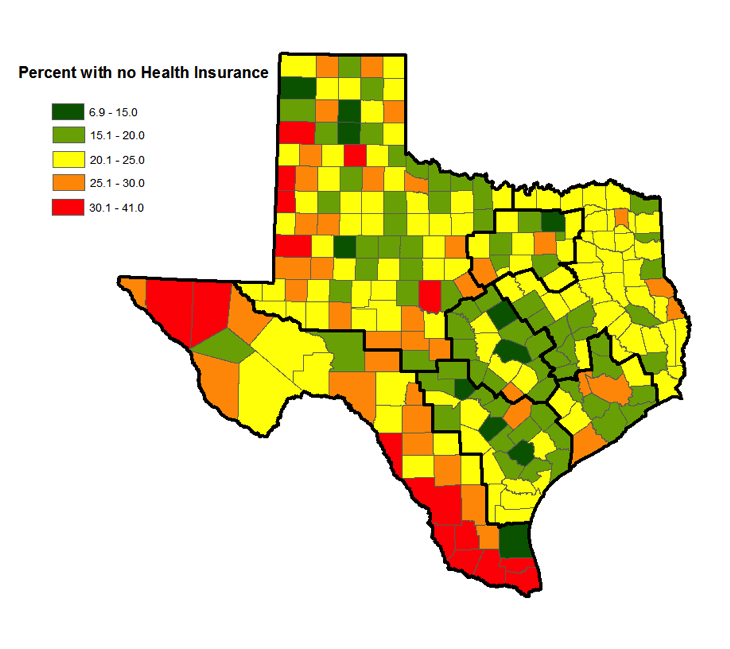
Health Insurance coverage rates are lowest in counties along the border with Mexico - from Eagle Pass to Brownsville, more than 30% of the adult household population had no health insurance. Health insurance coverage rates were also low (> 25% with no insurance) in the state's two largest metropolitan counties—Harris and Dallas. These data are now somewhat dated because of recent changes in health insurance coverage rates that are not well-documented at the county-level. The county-level patterns depicted here are likely to remain.

