Multiomics Analysis
WHAT IS MULTIOMICS?
Multiomics is an holistic approach to studying biology through combining data sets from multiple "omes". For example, combining data obtained from the transcriptome and proteome can inform what genes are expressed and being translated. Other "omes" can also be analyzed, including the metabolome or lipidome, the amount of polar metabolites and lipids, respectively. By combining multiple omic data sets, a deeper understanding of biological processes can be discovered.
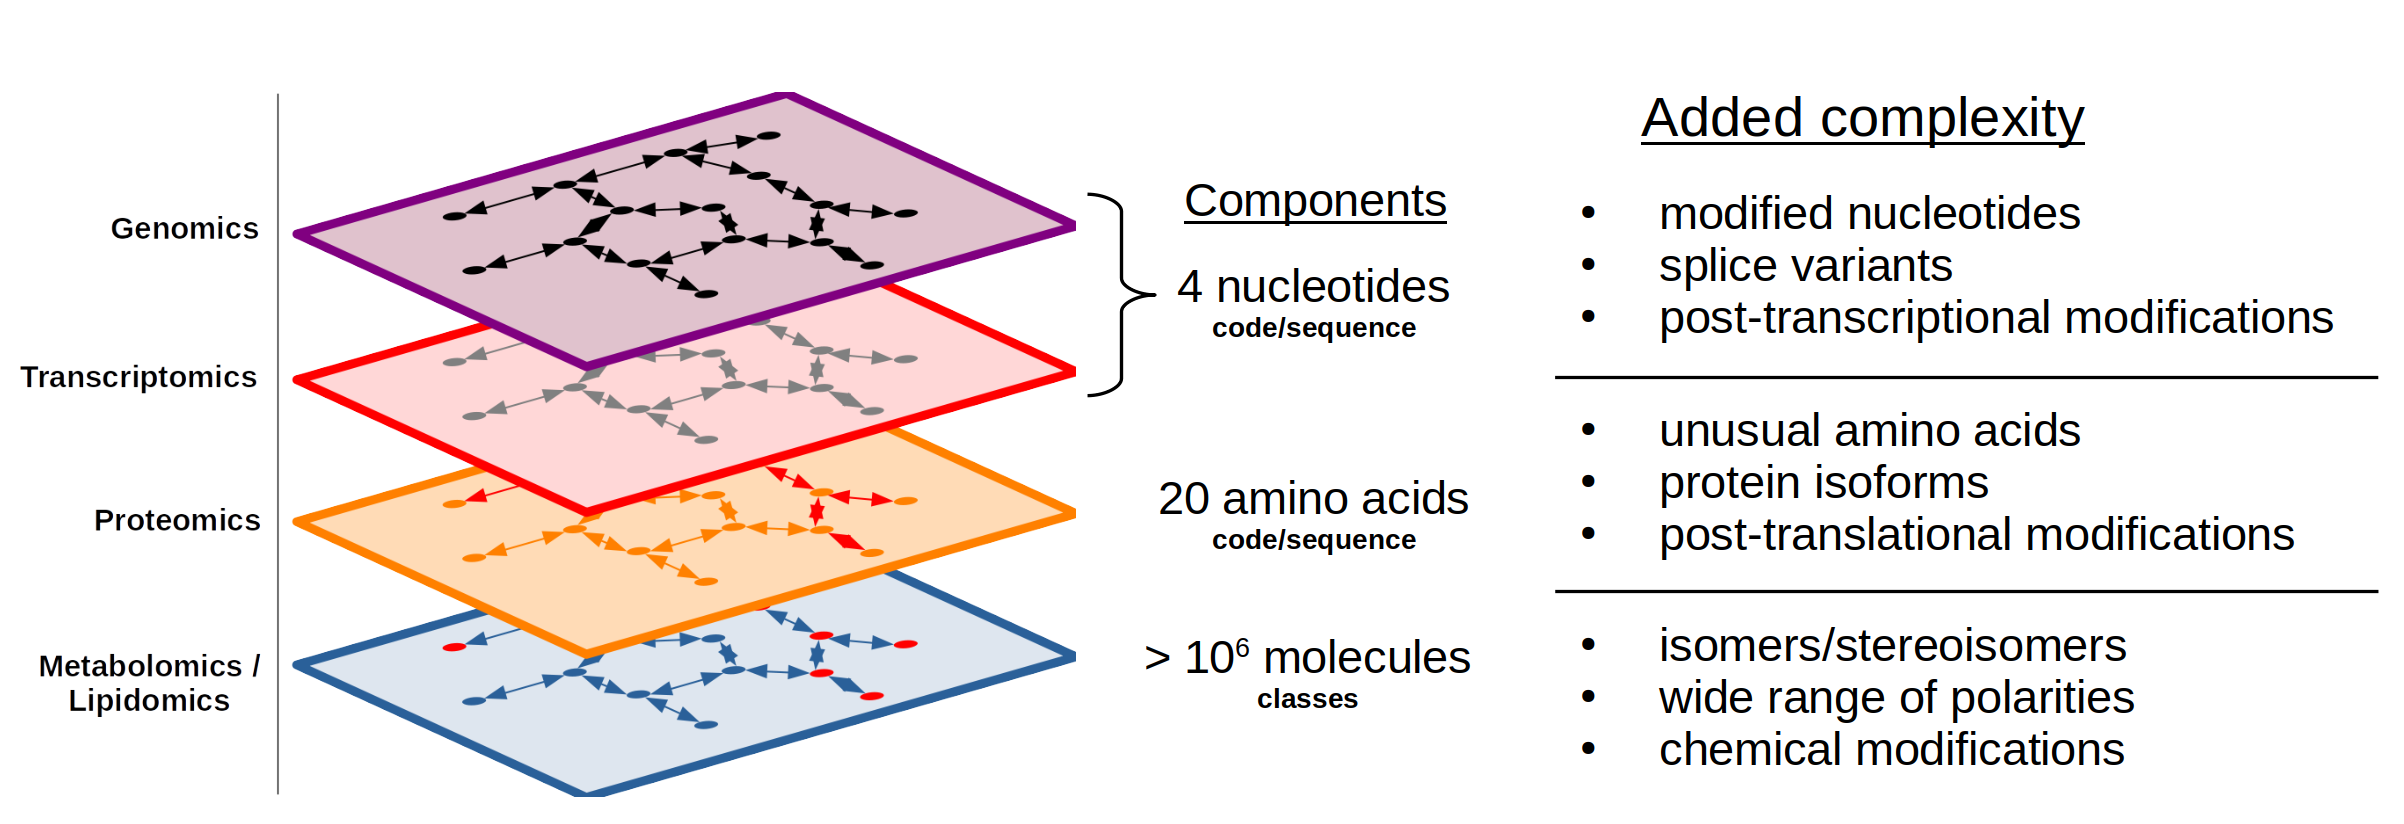
The different "omes" can be thought of as layers to biological processes (Figure 1) that range from the genotype to the phenotype. At the top layer is the genome that acts as the blueprint for biological pathways. The next layer is the transcriptome that describes which pathways are expressed from the genome. Further down is the proteome that describes which transcripts are translated into proteins that act within metabolic pathways. Finally, there is the metabolome and lipidome which are the substrates and products of biological pathways and are a representation of the biological phenotype. There are other more niche "omes" as well, e.g. epigenome and microbiome, that are not covered here. Additionally, there are subcategories of different "omes" such as the phosphoproteome that covers the phosphorylated proteins of the proteome. (Contact us for more information on these specialized analyses).

WHY PERFORM MULTIOMICS?
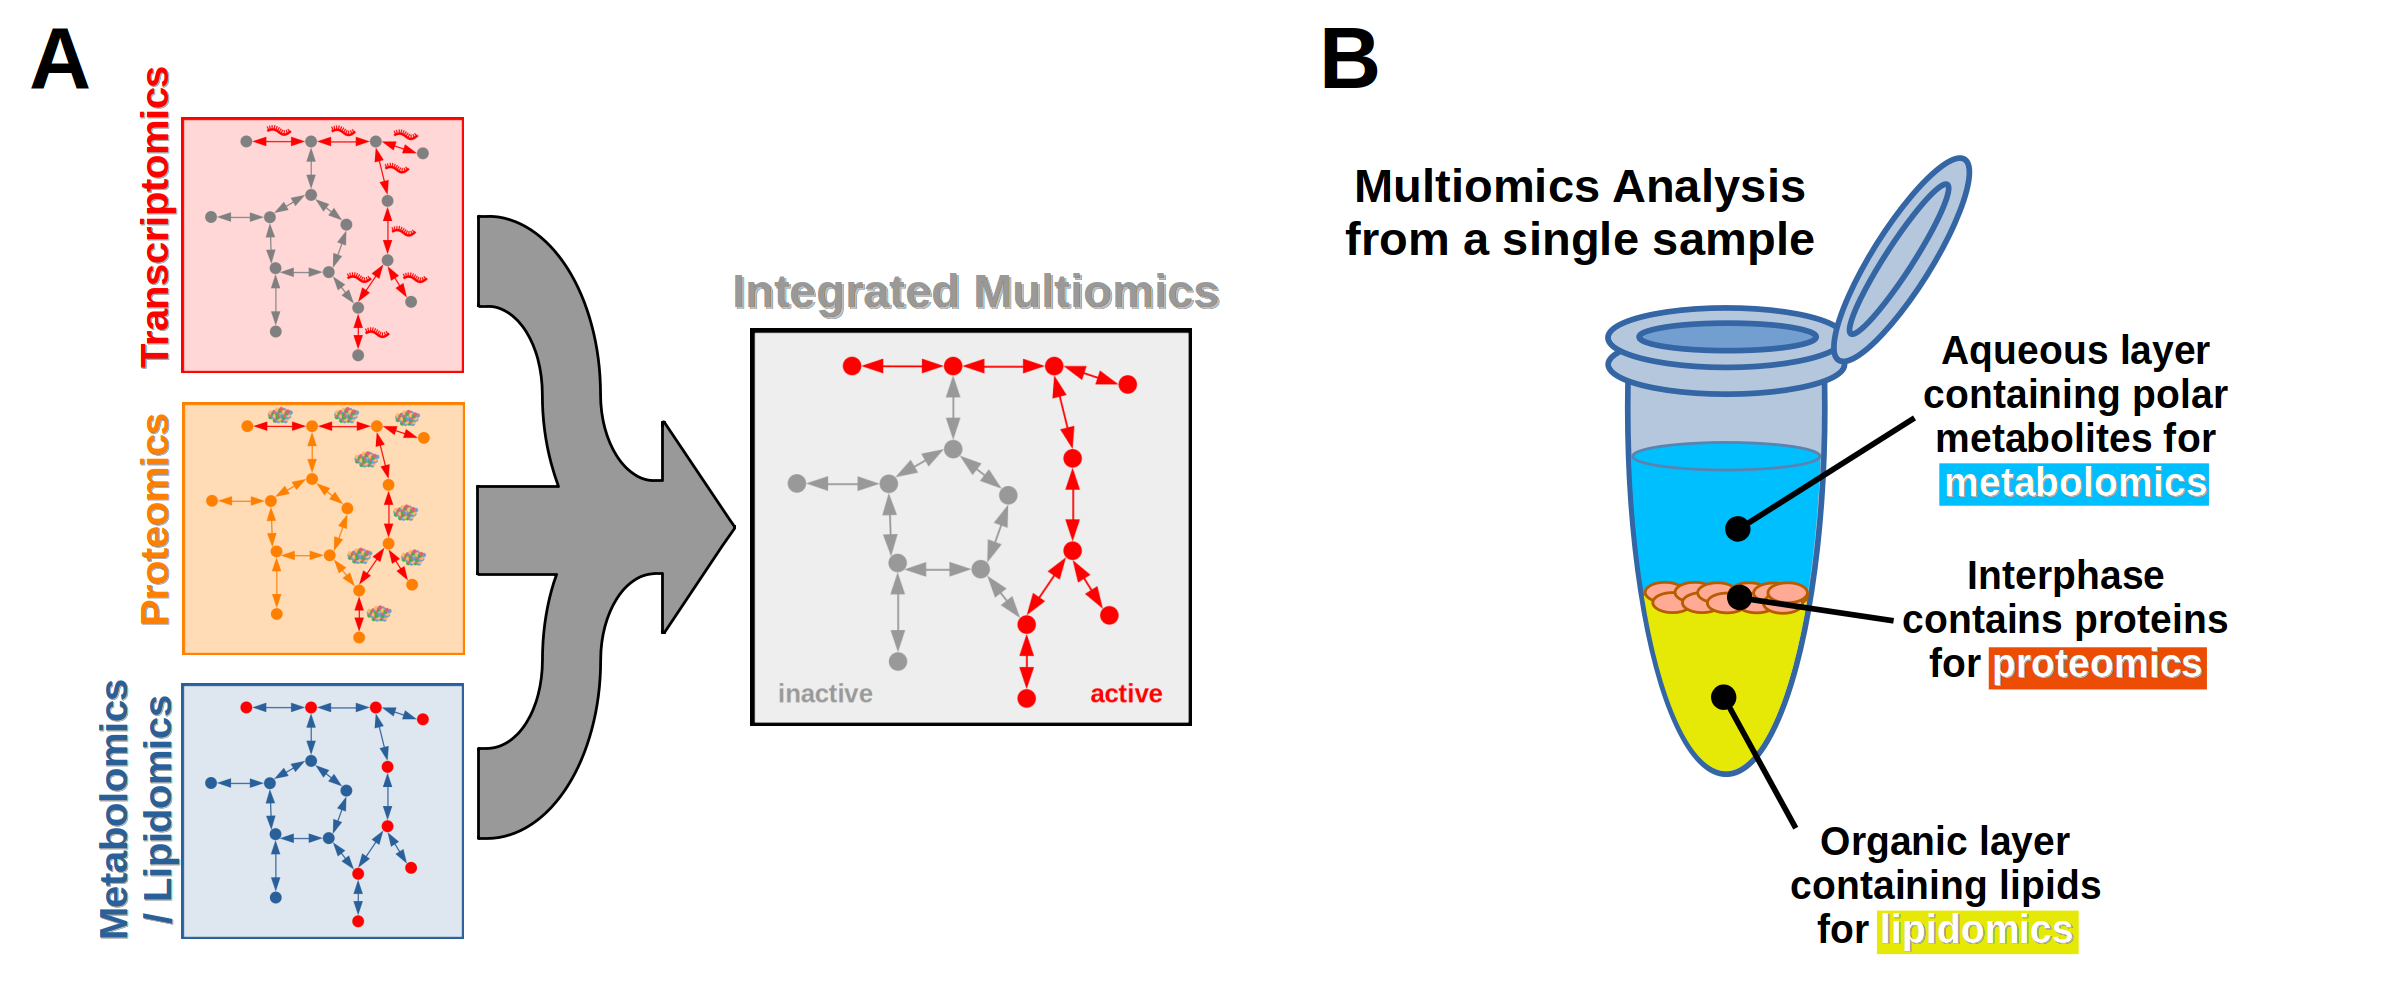
Each omics data set is a way of looking at a biological process from a different angle. However, a single omics data set will not give a complete picture of the biology occurring. For example, transcriptomics describes which genes are expressed and which are not, but it doesn't necessarily account for which transcripts are translated into proteins and active in metabolic pathways. Likewise, proteomics may describe which proteins are translated but not fully show which enzymes are active or inactive without measuring metabolites or lipids. By combining multiple different omics data sets, a full picture of which biological pathways are active or inactive emerges (Figure 2A).
Each omics layer requires a different analytical technique to measure its content. At MSF, we use mass spectrometry to measure proteomics, metabolomics, and lipidomics. Generally the molecules of interest are isolated using extraction techniques that specifically target an "omes" layer's components. It's also possible to use a biphasic extraction on the same sample to separate into an aqueous and organic solvent layer along with an interphase to isolate polar metabolites for metabolomics, proteins for proteomics, and lipids for lipidomics (Figure 2B). Each isolated fraction is then processed and analyzed by liquid chromatography-mass spectrometry (LCMS). This will maximize the information gained from a single sample and minimize the amount of starting material.

WHAT IS LEARNED FROM MULTIOMICS?
Ultimately the goal of a multiomics analysis is to understand complex biological processes and how the different "omes" interact with one another to produce an observed phenotype (e.g. disease state, development, etc.). In the context of clinical research this can lead to novel biomarkers or therapeutics. For fundamental biology, it provides a greater understanding of metabolic and cellular processes. Combining multiple omics data sets shows which pathways are active and which are inactive under different experimental conditions.
